


The Carbon Dioxide Number

“They are the single most important environmental data set taken in the twentieth century,” ___Charles F. Kennel, Scripps Institution of Oceanography, 2005.

In 1955, a young postdoctoral fellow in the geochemistry department at the California Institute of Technology (Caltech) performed a simple experiment. He measured the amount of carbon dioxide in the air around Pasadena. Our young scientist probably never imagined that this was the beginning of an extraordinary journey. In the next few years, it will take him to several places, most times, remote and uninhabitable, on the west coast of the United States and Central America. It will also set the stage for today’s profound concerns about climate change.
Charles David Keeling was born in Scranton, Pennsylvania on April 20, 1928. He studied chemistry at the University of Illinois in 1948, and he completed his Ph.D. in Chemistry from Northwestern University in 1954. In 1953, he was appointed postdoctoral fellow at Caltech. It was then that he started thinking about the problem of measuring the levels of carbon dioxide in the atmosphere.
Keeling was not the only scientist thinking about the rising levels of carbon dioxide. Since the end of the nineteenth century, scientists like Svante Arrhenius and Arvid Högbom had suggested that the burning of fossil fuels adds carbon dioxide to the Earth’s temperature and that there might be a direct relationship between rising atmospheric carbon dioxide and rising global temperature. Arrhenius wasn’t particularly alarmed, though. He thought that the oceans provided a reservoir of almost infinite capacity to absorb excess carbon dioxide.
But in the 1950s, scientists began to think that the absorbing capacity of the oceans might be limited. They realised that the ocean’s ability to act as a carbon sink is influenced by a number of factors, one of them is ocean’s slow mixing within deeper waters. Accurate measurements of atmospheric carbon dioxide thus became a rather pressing issue of scientific interest.
Meanwhile, at Caltech, Charles D. Keeling was devising a precision gas manometer that would allow him to measure concentrations of carbon dioxide in the atmosphere. He then began taking air and water samples every four hours, twenty-four hours a day not only from his surrounding environment but also from ocean beaches and rivers, and from remote locations while hiking in the White Mountains and Sierra Nevada of California. Keeling’s landmark innovation and his persistence to measure CO2 with the greatest precision and the greatest accuracy that he can, would fundamentally change our understanding of how humans impact Earth’s climate.
The first thing Keeling detected after analysing his samples, using an isotope ratio mass spectrometer controlled for temperature, pressure and volume, down to a precision of 0.1%, was an intriguing diurnal pattern. The air contained more carbon dioxide at night than during the day. That is because during the day, plants use carbon dioxide and emit oxygen during the photosynthesis process. Then he noticed something else, more important. Regardless of location, after correcting for the effects of water vapour, the amount of carbon dioxide in the atmosphere was about the same every afternoon, 315 ppm (parts per million. [1]
Also in the 1950s, the physicist and engineer Lloyd Berkner, a man of great energy and many interests, started to investigate the development of the Earth’s atmosphere. But the lack of available and reliable data had made it difficult for him to continue his research. He felt that fundamental questions about global-scale environmental processes would remain unsolved unless opportunities were created to collect data on a worldwide basis. He proposed a large-scale global research programme of intergovernmental cooperation, modelled on the International Polar Years of 1882-1883 and 1932-1933, that would allow scientists from around the world to take part in a series of coordinated observations of various geophysical phenomena. The result was the International Geophysical Year (IGY) of 1957-58. Much of America’s space research was born out of this moment.
In anticipation of the upcoming IGY, a growing number of scientists had turned their attention to carbon dioxide concentrations in the atmosphere and Keeling’s measurements have started to attract some attention. Harry Wexler, a visionary scientist at the Weather Bureau, the precursor agency of NOAA, invited him to Washington D.C. to discuss how stable the number 315 ppm might be and whether it was as universal as Keeling suggested.
In the meeting which took place early in 1956, Keeling suggested measuring atmospheric carbon dioxide continuously and proposed the set up of a continuous carbon dioxide analyser on Weather Bureau’s remote observatory of the Mauna Loa volcano, on the island of Hawaii. Wexler, apparently impressed by Keeling’s work, agreed, and they even discussed the possibility of setting up a second continuous analyser in Antarctica. Then the meeting was over. It lasted only 15 minutes. [2]
Wexler offered Keeling the job of leading the Weather Bureau’ s proposed carbon dioxide programme. But Keeling had also received another offer from Roger Revelle, director of the Scripps Institution of Oceanography in La Jolla, California. Revelle wanted to establish a reliable baseline, including consistent atmospheric measurements of carbon dioxide. He managed to secure some funds to set up a laboratory for continuous CO2 measurements and asked Keeling to run it, making sure that he would also able to conduct his Weather Bureau research. Keeling accepted the offer and he remained at Scripps for the next forty-three years.
Roger Revelle was also present at the Washington D.C. meeting with Harry Wexler. One of the pioneering researchers in the study of the human influence on the atmosphere, carbon cycle and climate, Revelle was studying the level of carbon dioxide exchange between the atmosphere and the oceans. In a seminal 1957 paper, co-authored with Hans Suess[3], an oceanographer, also from Scripps, they argued that “humans are carrying out a large geophysical experiment of a kind that could not have happened in the past nor be reproduced in the future”. Considering “the probably large increase in CO2 production by fossil fuel combustion in the coming decades” they concluded “that a total increase of 20 to 40% in atmospheric CO2 can be anticipated.” They couldn’t be more prophetic. [4]

In 1956, Keeling arrived at Scripps and immediately started implementing the U.S. atmospheric carbon dioxide program by building an infrared gas analyser that could measure atmospheric carbon dioxide concentration within an air sample. It was set up in Little America station in Antarctica later the same year, but had some equipment problems and couldn't be used until March 1957. A year later, in March 1958, Keeling installed a second gas analyser at Mauna Loa in Hawaii and on the first day of operation recorded an atmospheric carbon dioxide concentration of 313 ppm.
Finally, in 1960, Keeling was able to report his initial findings in a paper in the geophysical journal Tellus. The first results of the measurements showed that the seasonally adjusted concentration of carbon dioxide in the air was 314.4 ppm, pretty close to his initial measurements.
Capturing the Earth’s breathing
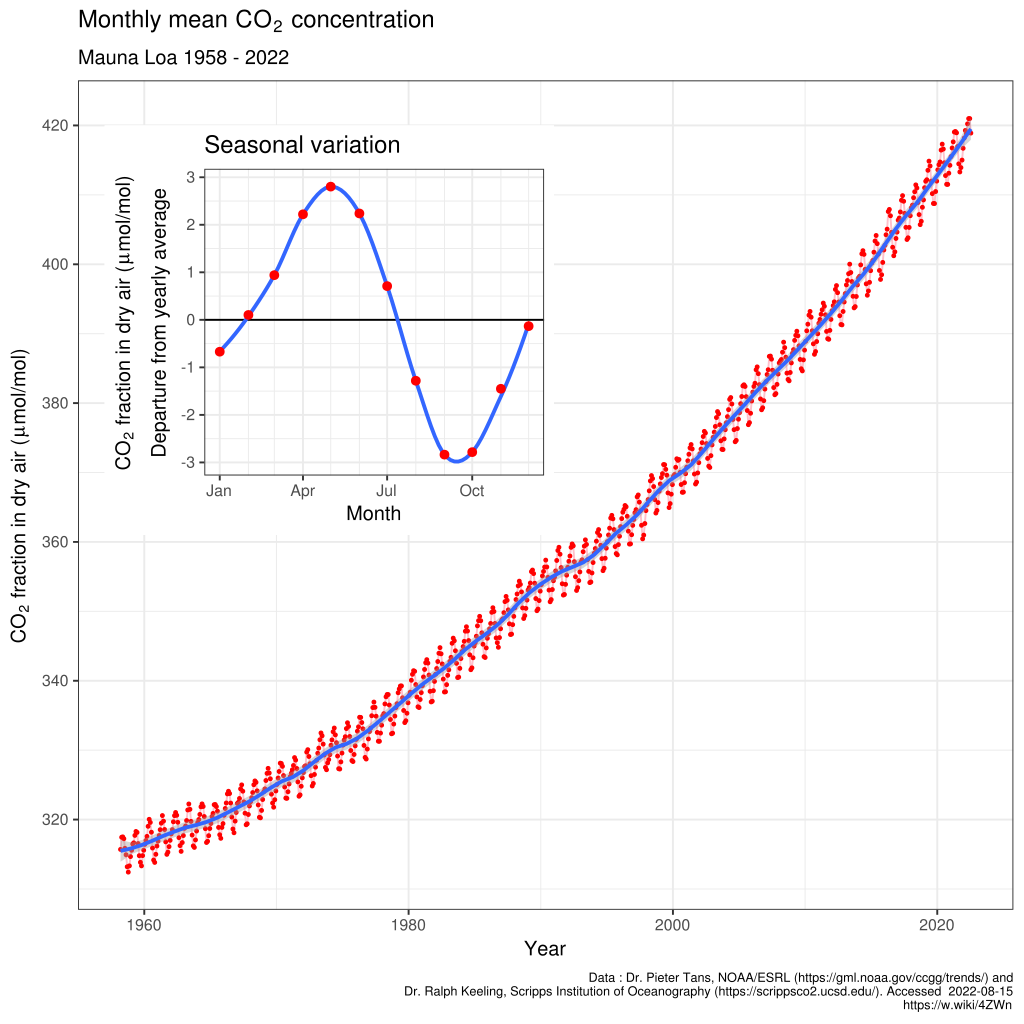
Although the rate of rise was not steady, the data collected from Mauna Loa showed that carbon dioxide was increasing year by year. It also indicated, when combined with earlier data, that the annual average carbon dioxide concentration rose 3.4% between 1959 and 1971.. Similar changes at the South Pole station suggested that this was a global phenomenon. In the 1960s, the annual increase of atmospheric carbon dioxide was about 1 ppm. One ppm of CO2 is about 2.12 GtC (gigatons of carbon). A gigaton is a billion tons, or 7.77 GtCO2. Today the annual increase is about 2.5 ppm per year.
The collected data showed something else, as well. A seasonal oscillation which repeats with remarkable regularity from year to year. As plants begin to photosynthesise in the spring, they take carbon dioxide from the air and the atmospheric carbon dioxide declines. In the autumn, when the plants decay and die, the atmospheric carbon dioxide rises again. Two regions contain the majority of lands and therefore plants, the Northern Hemisphere and the tropics, but due to large seasonal variations in temperatures, the seasonal swings in carbon dioxide are more pronounced in the Northern Hemisphere than in the tropics.
Within a few years of measurements, the Mauna Loa record, or the “Keeling Curve”, as it is called, became “the central icon of the greenhouse effect.” It was, Spencer R. Weart writes in his book, The Discovery of Global Warming, “not quite the discovery of global warming. It was the discovery of the possibility of global warming.” It created opportunities for further research, and stimulated scientists, such as the meteorologist Suki Manabe, a pioneer in the development and application of computational models to understand climate and climate change. Manabe made major advances in understanding of the global ocean-atmosphere system and he was named among the winners of the 2021 Nobel Prize in Physics.
In 1976, Keeling and his colleagues published another paper at Tellus, titled, Atmospheric carbon dioxide variations at Mauna Loa observatory”, where they were able to document and report “the effects of the combustion of coal, petroleum, and natural gas on the distribution of CO, in the atmosphere.”
In 2002, the National Sciences Foundation Committee recommended Charles D. Keeling to receive the National Medal of Science, the highest U.S.A. award for scientific research and outstanding contributions to science. There is a certain irony that he received his award from President George W. Bush, a global warming sceptic whose administration blocked even the most modest reforms on emission reductions, by adopting a do-nothing policy on climate change. [5]
Charles D. Keeling died in 2005, aged 77. He continued his research into carbon dioxide at the Scripps Institution of Oceanography in San Diego, until his final day.
The actual increase of atmospheric CO2 concentrations between 1958, when the measurements in Mauna Loa started, and 2000 was 17%; by December 2007 it has been increased 22%. It was 315ppm in March 1958, 384ppm in December 2007. Today is 418ppm.
Afternote:
The day I published this post, and due to Mauna Loa’s volcanic eruption in Hawaii, the Mauna Loa Observatory stopped recording data. The eruption, which started early on Monday morning for the first time in 38 years, has cut off power and access to the critical climate tool used to maintain the Keeling Curve, and impacted the road used to access the Observatory. Eventually it will get back up again, but it could take months. It’s bid deal.
References and sources:
Belanger, D. O. (2006). Deep Freeze: The United States, the International Geophysical Year, and the Origins of Antarctica’s Age of Science. University Press of Colorado.
Keeling, C. D. (1960, June). Concentration and isotopic abundances of carbon dioxide in the atmosphere. Tellus, 12(2), 200-203.
Keeling, C. D., & Miller, J. (1978). The Influence of Mauna Loa Observatory on the Development of Atmospheric CO2 Research. Boulder: NOAA Environmental Research Laboratories. Retrieved from Library US San Diego: https://library.ucsd.edu/scilib/hist/Keeling_Influence_of_Mauna_Loa.pdf
Keeling, C. D., Bacastow, R. B., Bainbridge, A. E., & et al. . (1976). Atmospheric carbon dioxide variations at Mauna Loa Observatory, Hawaii. Tellus, 28(6), 538-551. doi:https://doi.org/10.3402/tellusa.v28i6.11322
Leindblom, K. (2015). Chemistry and Chemists That Transformed our Lives: The Keeling Curve. American Chemical Society. San Diego : American Chemical Society.
Monroe, B. (2013, April 3). The History of the Keeling Curve . Retrieved from The Keeling Curve
Revelle, R., & Suess, H. E. (1957). Carbon Dioxide Exchange between Atmosphere and Ocean and the Question of an Increase of Atmospheric CO2 During the Past Decades. Tellus, 9, 18-27.
Trends in CO2. (n.d.). Retrieved from Global Monitoring Laboratory: https://gml.noaa.gov/ccgg/trends/gr.html
Weart, S. R. (2008). The Discovery of Global Warming . Harvard University Press.
Notes
[1] In The History of the Keeling Curve, B. Monroe says that the measurement of carbon dioxide was 310 ppm, but since Keeling says in his paper , The Influence of Mauna Loa Observatory on the Development of Atmospheric CO2 Research, that it was at around 315 ppm, I opted for Keeling’s measurement.
[2] The first carbon dioxide analyser was set up in Antarctica in 1956, but it couldn’t be used until the following, due to equipment problems. A second carbon analyser had also been also prepared for installation aboard a Scripps research vessel, set to launch in the fall of 1957.
[3] Hans Suess had already established, by measuring the proportions of radioactive and non-radioactive isotopes of carbon (Carbon-14), that some, but not all of the carbon released by burning fossil fuel would be absorbed by the oceans (Wanke & Arnold, 2006).
[4] Almost twenty years later the Senator and later Vice-President Al Gore mentions Revelle, his professor in 1968 at Harvard, as a personal inspiration. (Al Gore, An Inconvenient Truth)
[5] Responding in May 7, 2001 to whether President Bush believes Americans need to correct their lifestyle to address the energy problem, Ari Fleischer, White House Press Secretary, replied. “That's a big no. The President believes that it's an American way of life, and that it should be the goal of policy makers to protect the American way of life. The American way of life is a blessed one. And we have a bounty of resources in this country. What we need to do is make certain that we're able to get those resources in an efficient way, in a way that also emphasizes protecting the environment and conservation, into the hands of consumers so they can make the choices that they want to make as they live their lives day to day.” Source: The George W. Bush White House Press briefings